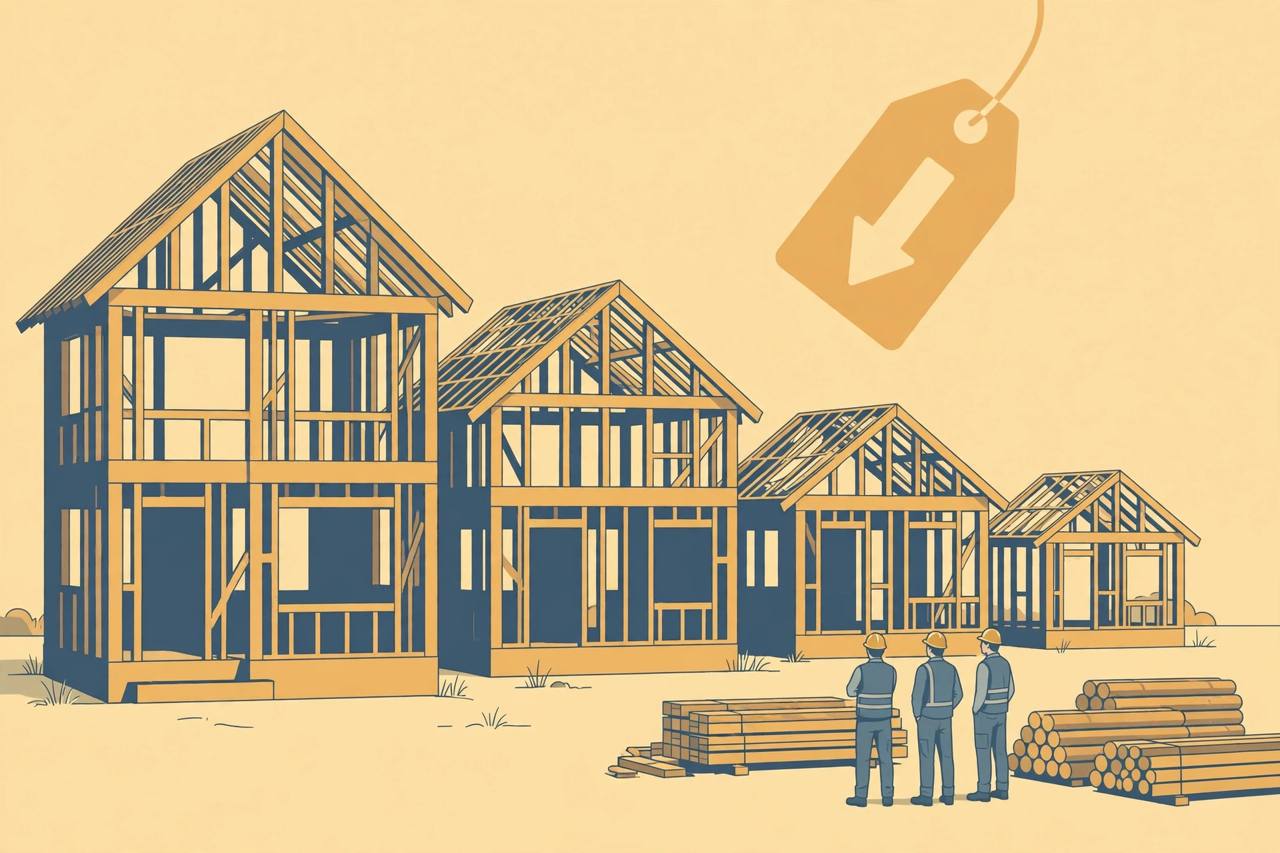
Confidence among US builders of new single-family homes fell four points in November to 25, the lowest reading since April 2012, the National Association of Home Builders said on Tuesday, November 17. The NAHB/Wells Fargo Housing Market Index came in well below the 29 economists expected in a Reuters poll and below October's 29, extending a slide from 38 a year earlier — a stark signal that the housing market, the biggest purchase most American families ever make, is cooling hard under mortgage rates above 7%.
Source: NAHB/Wells Fargo Housing Market Index
The index is a monthly survey of single-family builders on a 0-to-100 scale, where any reading above 50 means more builders see conditions as good than poor. November's 25 is only the third reading this low since November 1990 in the survey's modern history, according to Inman's analysis of the release, and it follows October's 29, which had itself been a 14-year low. In other words, builder sentiment has now set a new post-financial-crisis low two months in a row.
Source: Inman
Every part of the survey fell
All three components of the index declined. Current sales conditions fell six points to 28 — that component has now dropped 11 points since August, the sharpest deterioration in the survey. Sales expectations for the next six months slipped two points to 30, and traffic of prospective buyers fell two points to 16, the weakest buyer-traffic reading in 15 years outside the first pandemic shutdown in 2020. Regional three-month moving averages also weakened across the board: the Northeast at 34, the Midwest at 35, the South at 27 and the West — home to California's Central Valley building corridors — at just 23, the lowest of the four regions.
Discounts at post-Covid highs
Builders are responding the only way they can: by cutting. In November, 46% of builders reduced prices, the highest share in the post-Covid period and, on the Scotsman Guide's reading of the series, the highest in six years, up from 43% in October, 38% in September and 35% in August. The average price reduction held at 6% for an eighth straight month. A full 68% of builders offered sales incentives — also a post-Covid high, and the 20th consecutive month in which at least 60% of builders used them, NAHB said.
What builders blame: rates, costs — and labour
NAHB Chairman Bill Owens, a builder and remodeler from Worthington, Ohio, pointed to a mix of cost pressures, and Inman reported that Owens cited strict immigration enforcement and higher fuel costs as factors driving labour shortages and construction cost increases, prompting builders to reduce activity amid weaker buyer demand. NAHB Chief Economist Robert Dietz said mortgage rates above 7%, softer consumer confidence and an uncertain economic outlook are holding buyers back, and that single-family builders are pulling back on construction volumes. The average rate on a 30-year fixed mortgage stood at 7.51% on Monday, according to Mortgage News Daily, compared with 6.38% a year earlier — a gap that adds hundreds of dollars a month to a typical new-home payment.
For Punjabi-American readers the labour point cuts both ways. Construction is one of the largest employers of Punjabi workers in California, Texas and the Northeast, from framing crews to finishing trades, and the industry's own trade body is now publicly linking tighter immigration enforcement to the worker shortages that raise building costs. At the same time, the discount wave — nearly half of builders cutting prices and two-thirds offering incentives — is the most buyer-friendly new-home market in years for diaspora families who have been priced out since 2021, particularly in Central Valley and Houston-area subdivisions where builders are competing hardest.
Why the index matters, and what happens next
The HMI has tracked — and in peer-reviewed research has helped predict — housing starts since its launch in January 1985. Its all-time low was 8 in January 2009 during the financial crisis, and its all-time high was 90 in November 2020, when pandemic-era low rates ignited a building boom. A reading of 25 does not predict a 2009-style collapse — builders stressed that this is an affordability and cost squeeze, not a credit crisis — but sustained readings in the 20s have historically meant fewer starts in the following months, which tightens future supply even as today's discounts help today's buyers.
The December HMI, due in mid-December, will show whether the Federal Reserve's expected December rate decision changes builder maths. Watch buyer traffic first: at 16, it is the weakest link — builders say confidence will not recover until buyers physically return to model homes.
What is solid
- The November HMI of 25, its three components (28, 30, 16) and the 46% price-cut and 68% incentive shares are NAHB's own published figures, released November 17.
- Reuters polling put the consensus forecast at 29; the index was 29 in October and 38 in November 2025.
What is only claimed
- Why confidence fell is builders' own assessment: NAHB leaders cite mortgage rates, costs, labour shortages and immigration enforcement among the causes. Those attributions are the association's position, not independent findings.
- Whether the slump becomes a construction pullback will only be confirmed by later housing-starts data; the HMI measures sentiment, not completed sales.